Disclaimer: This post is a personal trading log for educational purposes. It is not financial advice.
Hello, this is Tapu.
In my previous post, I introduced a trading strategy combining the MACD Histogram and the 200 EMA.
Theory is useless without execution.
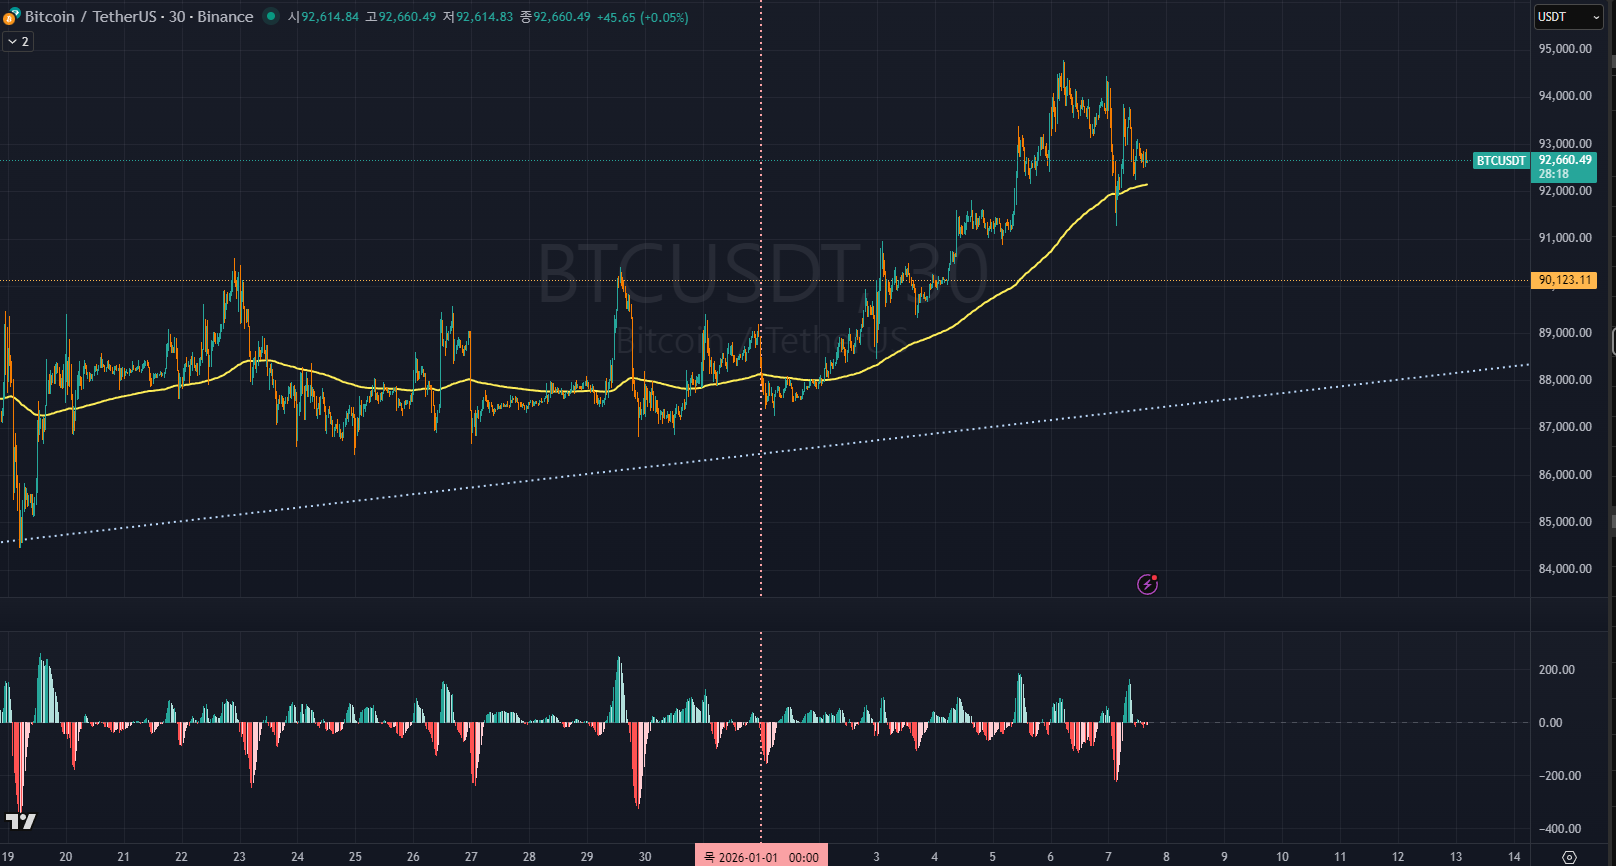
To verify the effectiveness of this strategy, I conducted a backtest using real market data from the first week of January 2026.
We covered two variations:
- Mean Reversion (Counter-Trend)
- Trend Following (With the Trend)
Today, I will share the raw results of applying Strategy #1 (Mean Reversion). Let's look at the numbers.
Trade #1: Jan 1st - The Flexible Exit
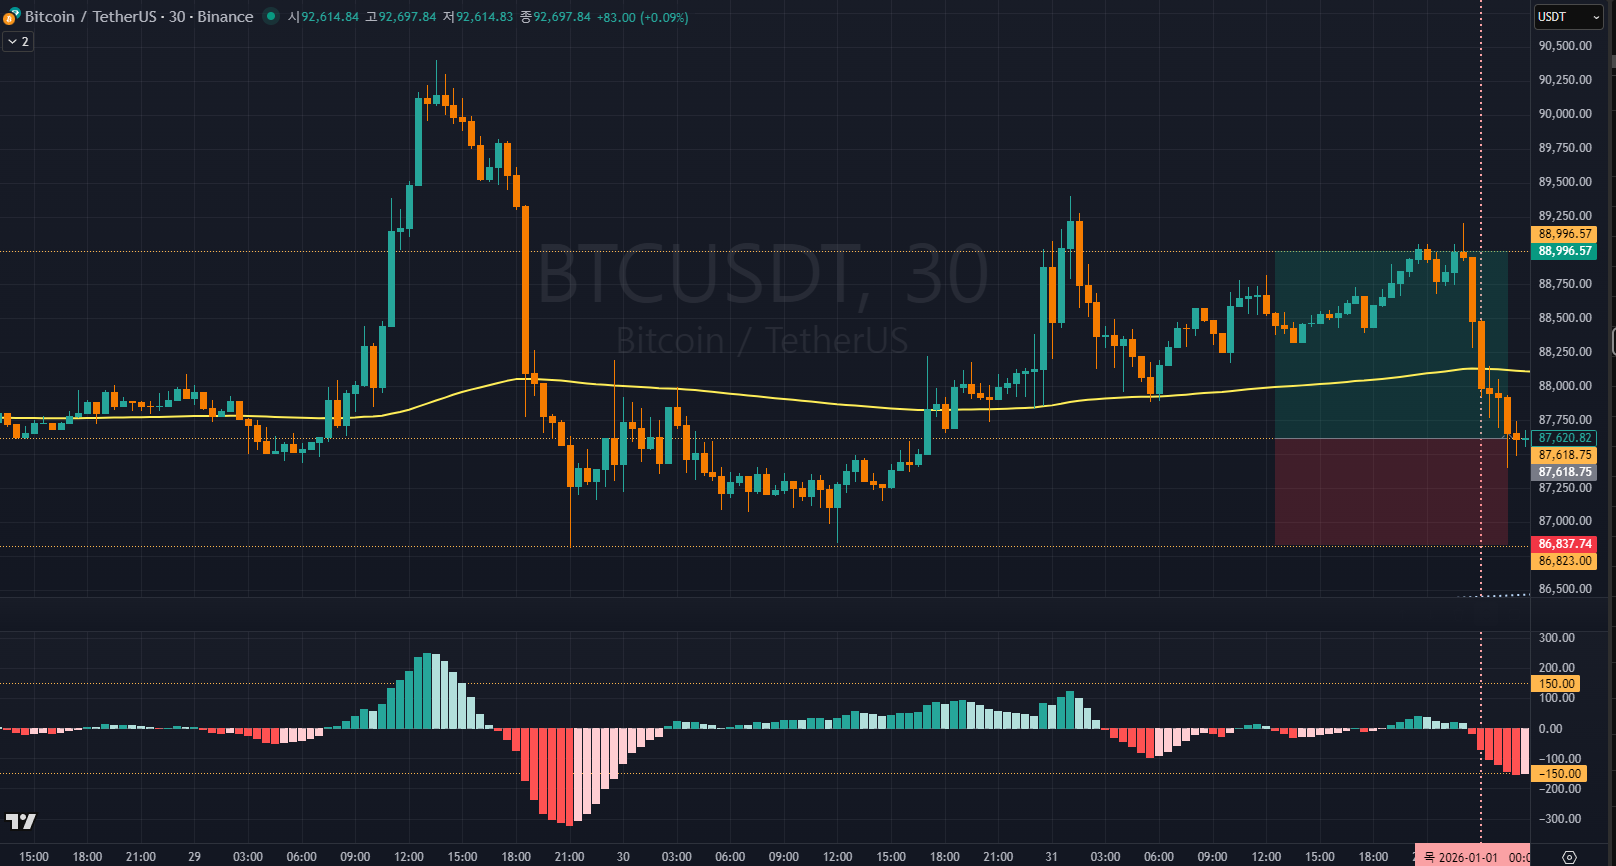
The year began with a textbook setup on the 30-minute chart.
The MACD Histogram dipped below the -150 threshold and then started to contract (tick upward), signaling a potential reversal.
- Entry: Long position triggered upon histogram contraction.
- Stop Loss: Placed at the recent swing low.
- Initial Target: Top of the visible trading box (Expected R:R = 1.74).
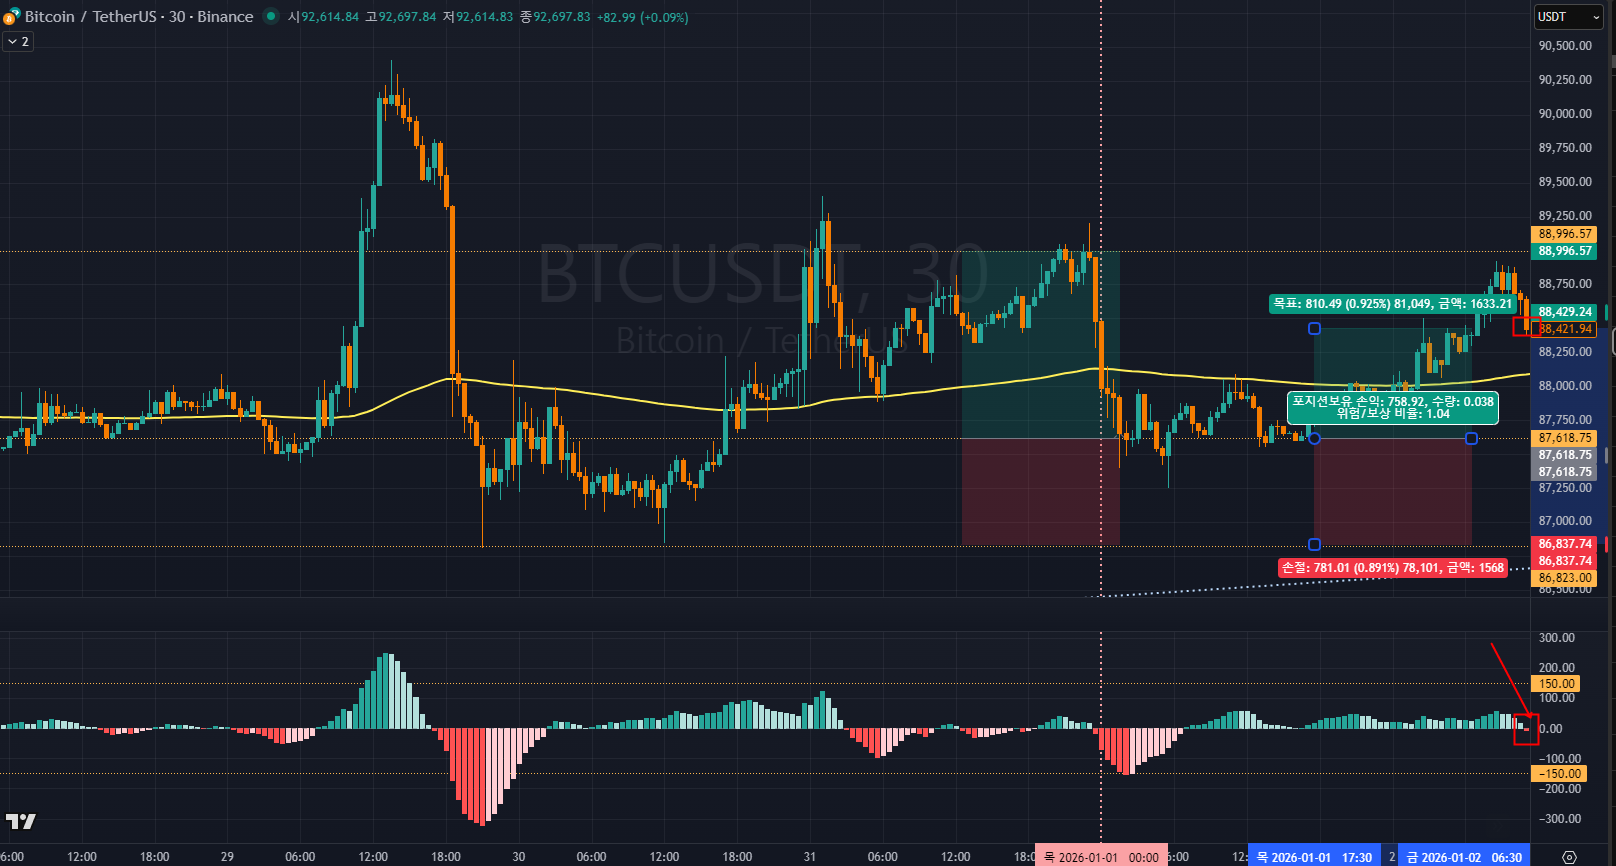
Analysis: The price rallied towards the target but struggled to break resistance.
Critically, the histogram flipped from Positive (+) to Negative (-) before hitting the final target.
Following the rule of "Momentum Shift," I closed the trade early to secure the profit rather than hoping for a breakout.
- Outcome: +1.0R (Win)
- Key Takeaway: Do not be rigid. If momentum dies, take the profit.
Trade #2: The Danger of Counter-Trend
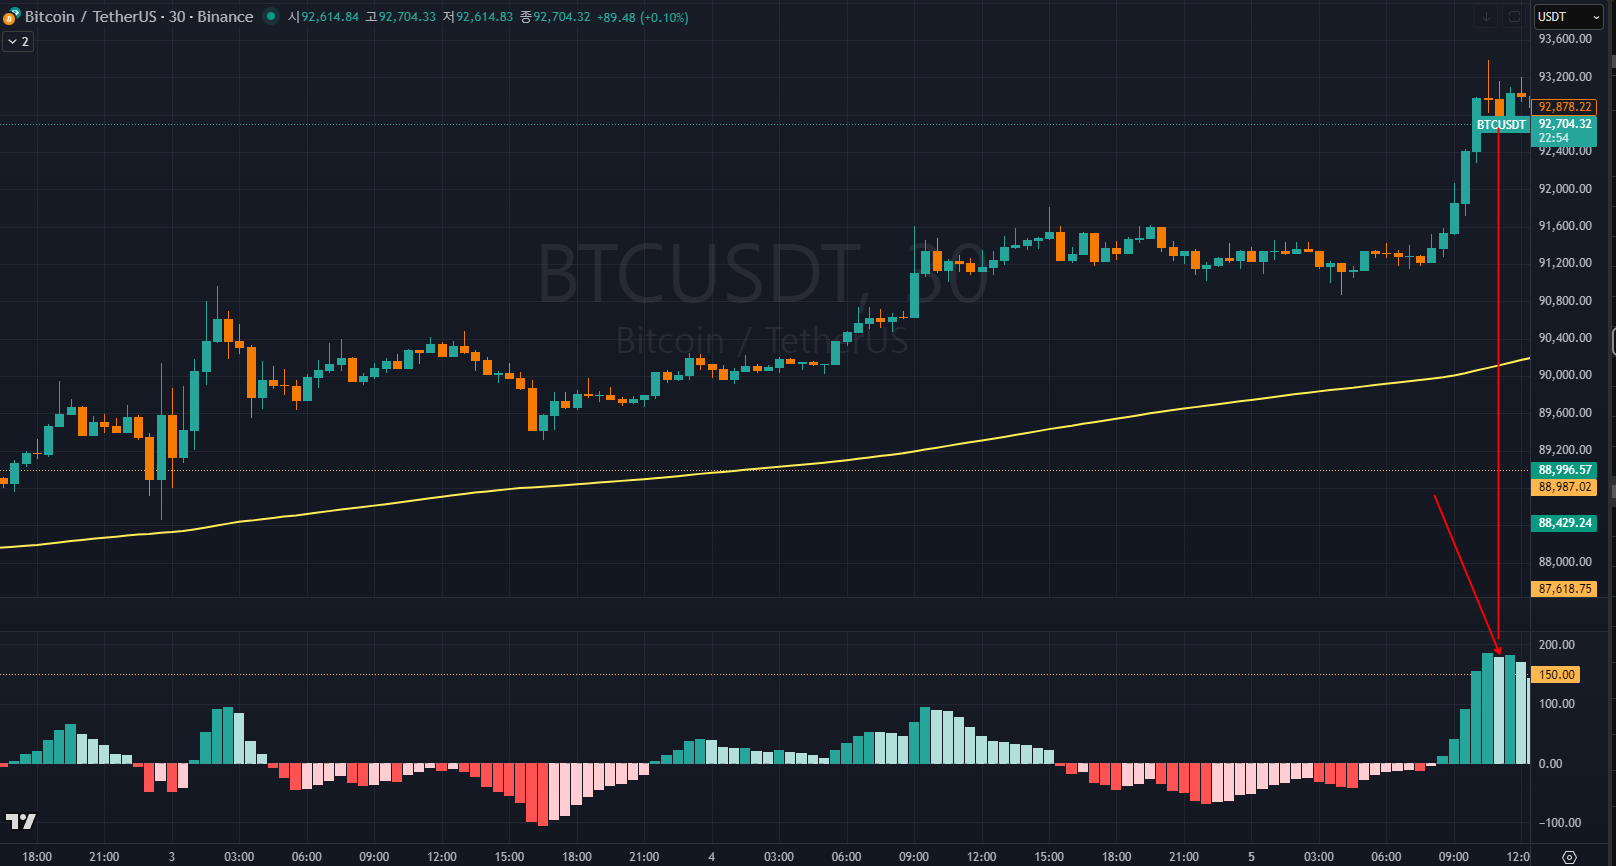
The second signal appeared during a strong uptrend. Price spiked, pushing the histogram above +150. It then contracted, suggesting a pullback.

- Entry: Short position triggered.
- Stop Loss: The immediate high was too close to the entry, increasing the risk of a "stop hunt." Therefore, I placed the stop at the previous major high.
- Target: Mean reversion area (Target R:R = 1.0)
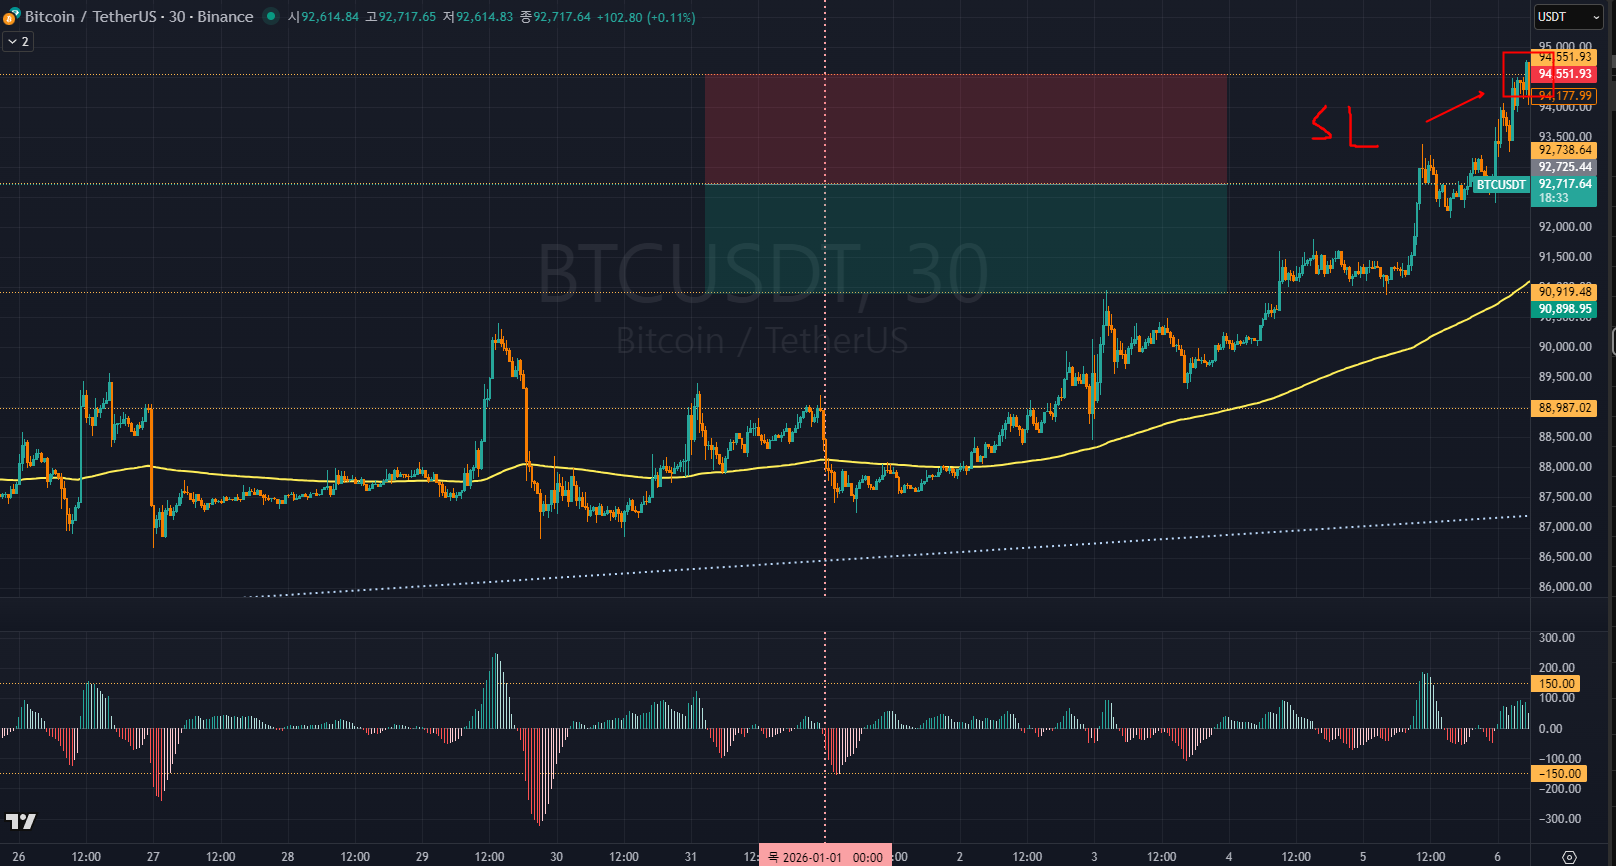
Analysis: The uptrend was relentless.
Despite the wider stop loss, the buying pressure continued, eventually hitting the stop.
This illustrates the inherent risk of Mean Reversion: sometimes the market doesn't want to revert; it wants to explore new highs.
- Outcome: -1.0R (Loss)
Trade #3: The V-Shape Recovery
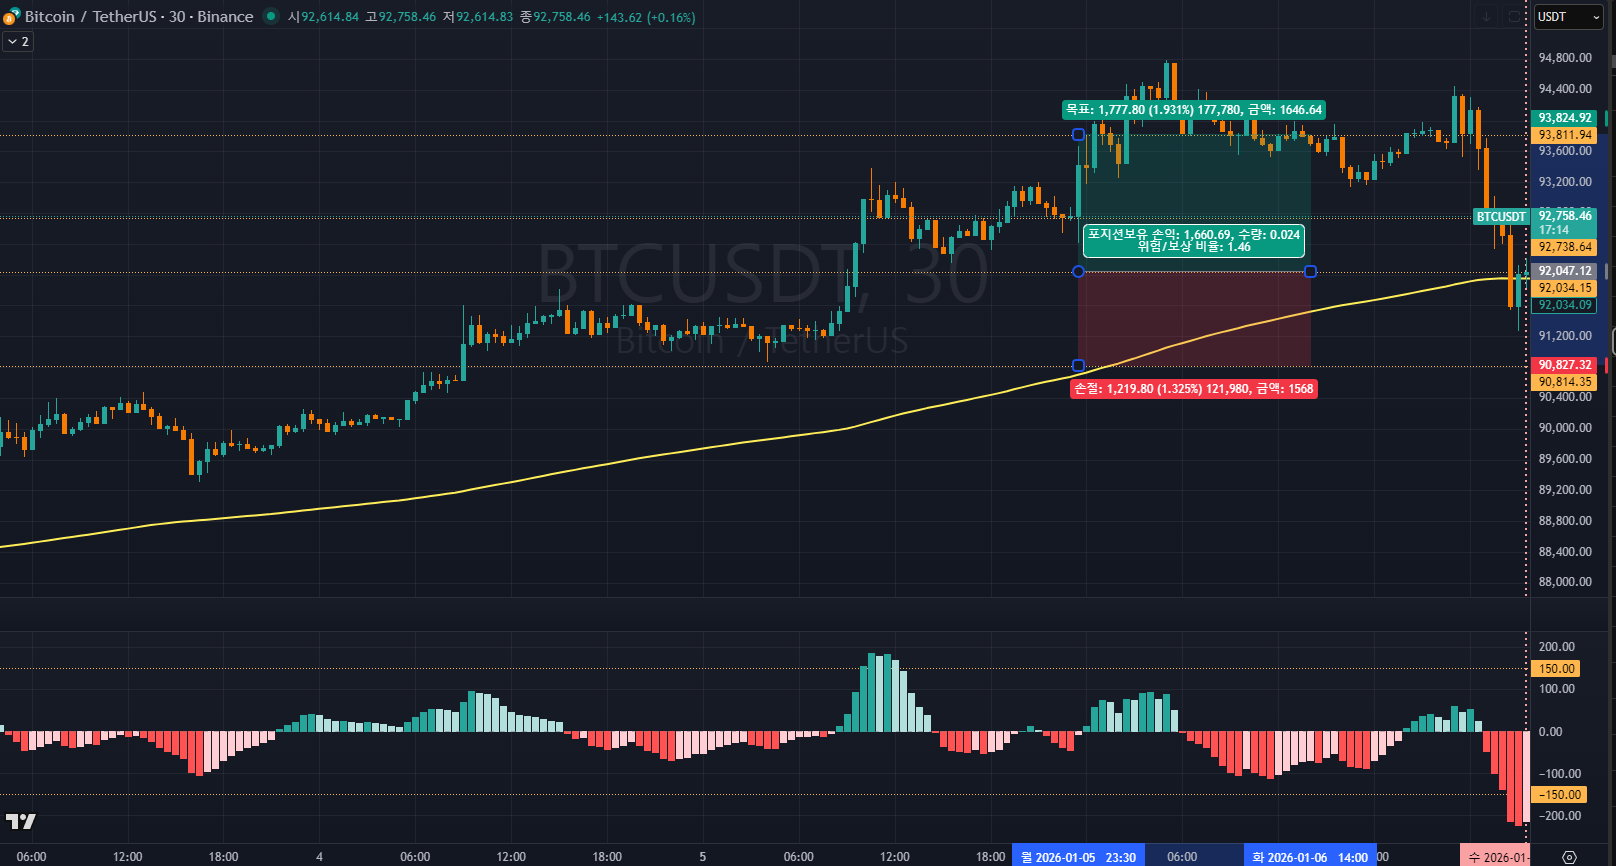
Market volatility increased, resulting in a sharp crash.
The histogram pierced through -150 deep into oversold territory.
Soon after, the contraction signal appeared.
- Entry: Long position on the reversal signal.
- Stop Loss: Placed tight below the recent low, as momentum was clearly shifting up.
- Target: Rebound target level (Expected R:R = 1.45).

Analysis: This was a perfect execution. The price rebounded sharply, touching the target precisely before consolidating. Buying fear when the signal confirms is often the most profitable trade.
- Outcome: +1.45R (Win)
Weekly Performance Review
Here is the summary for the first week of January using only the Mean Reversion strategy:
- Win Rate: 66% (2 Wins / 1 Loss)
- Net Profit: +1.0 - 1.0 + 1.45 = +1.45R
What does this mean? If you risked 1% of your equity per trade, your account grew by 1.45% in just one week. Consistency is the secret weapon of professional traders.
Next Up: This was only the "Mean Reversion" test.
In the next post, I will backtest the "MACD Trend Following" strategy for the same period to see which one performed better.
🎁 Tools for Traders
To track your trades and calculate risks like I do, download my personal Trading Checklist & Calculator.
- Join Bybit (Fee Discount): 👉 Sign Up Here
- Request the Data: 👉 Get the PDF
#MACDStrategy #Backtesting #TradingJournal #CryptoTrading #MeanReversion #TechnicalAnalysis #TapuTrading #BitcoinAnalysis


댓글